By harnessing the exquisite potency and molecular specificity of the immune system for cancer cell destruction, immunotherapy has changed the landscape of clinical oncology. Adoptive cell therapies such as chimeric antigen receptor (CAR) T cells, where T-cell cytotoxicity is redirected against cancer cells, are among the frontrunners in this rapidly evolving field.1 During their development, it is necessary to rigorously compare CAR constructs and determine their cancer-killing efficacy. Release assays (Cr51, lactate dehydrogenase) are the gold standard method to assay cancer cell killing, but these assays require significant “hands on” time and provide only end-point data. Here we demonstrate an alternative method, using the Agilent xCELLigence RTCA eSight, to continuously monitor CAR T-cell killing of cancer cells over multiple days.
The Agilent xCELLigence RTCA eSight simply requires target cancer cell seeding and a subsequent addition of CAR T cells to provide a direct assessment of target cell number, cell size, and cell substrate attachment strength (Figure 1). Impedance biosensors in the base of eSight microplates quantitatively track the continuum of target cell killing, spanning from early (reduced cell substrate adhesion strength) to late (lysis) events.

Concurrently, eSight captures live brightfield and fluorescence cell images, providing an orthogonal readout of the killing process. By combining the strengths of real-time impedance monitoring (simplicity, analytical sensitivity, and objectivity) with that of live-cell imaging (specificity of the readout), the eSight increases the information richness of the CAR T-cell killing assay without increasing the workload.
CAR T-cell killing assay
All steps of the killing assay were conducted in an E-Plate VIEW microplate (Agilent Technologies, part number 00300601030). After background impedance was measured while 50 µL of media/well was used, 10,000 HEK-293-CD19 target cells (in 100 µL of media) were added to each well. Alternatively, for suspension target cells, an antibody tethering strategy could have been used to attach the cells to the electrode surface.
After proliferation was monitored for 23 hours, 50 µL of media was aspirated and replaced with 50 µL of media containing either mock or CD19 CAR T cells. T-cell numbers were varied to achieve E:T ratios of 0.06, 0.12, 0.25, 0.5, 1, 2, or 4.
Whereas impedance was measured every 15 minutes, images were acquired every 90 minutes. In each well, four fields of view were captured for each channel (brightfield and red fluorescence). Exposure times were as follows: red (300 ms), brightfield (automatically optimized by the eSight software). When impedance data were used, the percent cytolysis was set equal to [1 − Normalized CItreatment / Normalized CItarget only] × 100. When target cell counts from the imaging data were used, the percent cytolysis was set equal to [1 – Normalized Counttreatment / Normalized Counttarget only] × 100.
Monitoring CAR T-cell killing activity by live-cell imaging
When left untreated for 48 hours, the RFP-expressing HEK-293-CD19 cells proliferated to the point of confluence (Figure 2A). However, after the target cells were exposed to CAR T cells for 48 hours, there was a clear reduction in the number of target cells present.

As expected, this killing response is dose-dependent, with the highest E:T ratios causing the most pronounced killing. As the E:T ratio increased, the unlabeled (gray) CAR T cells became more prominent in the field of view, and the clustering of these T cells (characteristic of activation) became more robust. At later time points, these T-cell clusters contained large numbers of red target cells, and these target cells displayed rounding/detachment and cytoplasmic shrinkage, characteristic of progressing through apoptosis. Repeating the assay while using a fixed E:T of 4:1 clearly indicated the time dependence of the killing response (Figure 2B).
Quantifying CAR T-cell killing efficacy
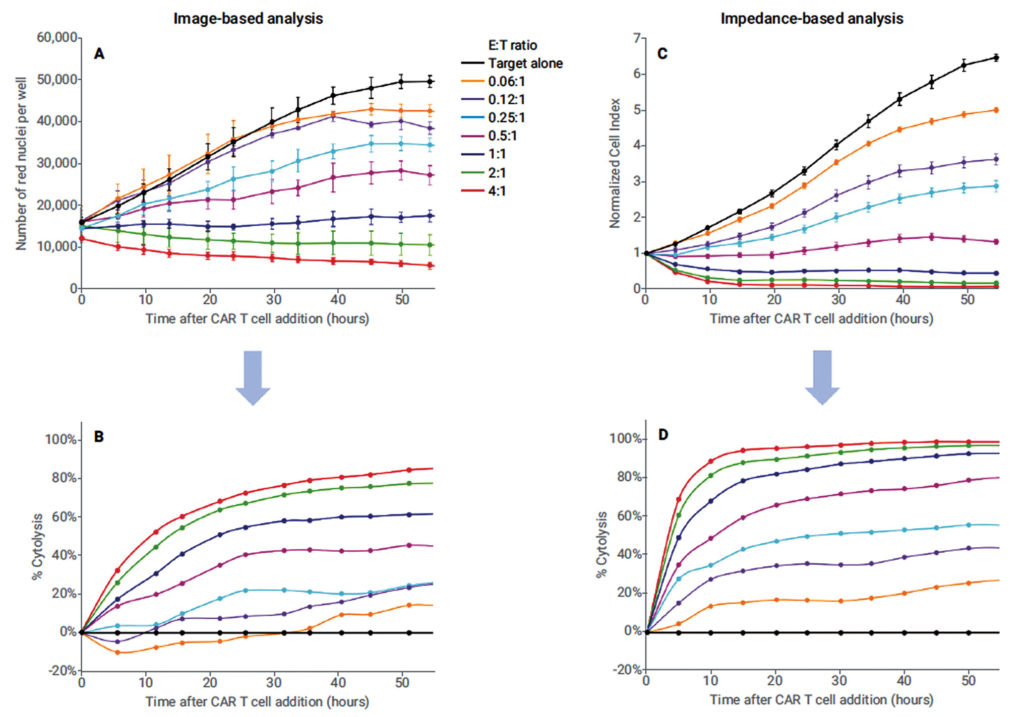
Although Figure 2 markedly demonstrates CAR T-cell killing, the data is inherently qualitative. To extract quantitative information, eSight software was used to count the number of red target cell nuclei present as a function of time; the data is plotted in Figure 3A. The zero-hour time point in this plot corresponds to the moment that CAR T cells were added to the well.
In the absence of CAR T cells, the target cells proliferate until the 50-hour time point (Figure 3, black data trace). When CAR T cells are added at the lowest E:T of 0.06:1, a killing response is not observed until the 30-hour time point (Figure 3A, orange data trace). Progressively increasing the E:T ratio causes the killing response to manifest earlier and ultimately results in more target cells being destroyed.

Tracking the killing response using impedance (Figure 3C) produces cytolysis curves that are similar to the image-based curves in terms of time- and dose-dependency. One salient difference between the readouts is that at E:T = 4:1, the impedance response drops to zero, whereas the number of target cells never drops below ~5,000.
This persistence of target cells even at late time points is consistent with the photos shown in Figure 2. The impedance signal falling to zero suggests that these lingering target cells are not strongly adherent to the well bottom. Consistent with this, nearly all the red cells visible after 48 hours of exposure to CAR T cells at E:T = 4:1 are rounded and appear to be loosely resting on the well bottom (Figure 2).
The simple equations detailed previously were used to convert the impedance data and the image-based data into percent cytolysis plots (Figures 3B & 3D). When plotted, the kinetics results for the killing response are strikingly different between the data sets, even though both data sets were collected from the same cell population. This difference arises because the two detection methods track CAR T-cell killing from different perspectives.
The eSight assay provides an extensive amount of information despite requiring minimal hands-on time. Every well simultaneously provides two independent data sets of impedance and live-cell images, and because each well of the E-Plate provides continuous readout, the collection of endpoints is unnecessary. The impedance readout is also highly objective, as it is reported directly, without any processing or input from the user.
The eSight CAR T-cell assay further distinguishes itself from release assays in terms of sensitivity. Because Cr51 spontaneously leaches out of target cells, resulting in a progressive increase in background signal, Cr51 release assays must be conducted over relatively short time periods. This requires the use of physiologically irrelevant high E:T ratios. In contrast, there are no inherent temporal limits for eSight assays, meaning that CAR T-cell killing activity can be interrogated at physiologically relevant E:T ratios (see E:T = 0.06:1 in Figure 3).
In conclusion, the Agilent xCELLigence RTCA eSight couples the simplicity, analytical sensitivity, and objectivity of real-time impedance monitoring with the highly specific readout of live-cell imaging to characterize CAR T-cell killing efficacy with unparalleled ease and information richness.
Jiaming Zhang, Grace Yang, and Peifang Ye represent Agilent Technologies, China. Nancy Li, Yama Abassi, and Brandon J. Lamarche represent Agilent Technologies, San Diego, CA.
Reference
1. Feins S, Kong W, Williams EF, et al. An introduction to chimeric antigen receptor (CAR) T-cell immunotherapy for human cancer. Am. J. Hematol. 2019; 94(S1): S3–S9.
Download the E-Book to discover how the Agilent xCELLigence RTCA eSight can provide unprecedented insights into cellular behavior and processes.
explore.agilent.com/esight_ebook

