Mass spec–based methods coupled with chromatography separation techniques are fundamental to success in proteomics research and biopharmaceutical development, and low-flow liquid chromatography has been the backbone of this work for more than two decades. Liquid chromatography–mass spectrometry (LC-MS) is used routinely to determine the safety and batch-to-batch consistency of biopharmaceutical molecules and to support the drug development process. Applications include intact protein analysis for the identification of post-translational modifications (PTMs) and analysis of protein digests
produced using sequence-specific enzymes, which enables the assignment of PTMs to specific subunits.
Today the growing use of microbioreactors for process optimization, and the widespread application of microwell-based methods at many stages in biopharmaceutical R&D, means that the amount of material available for many analyses is increasingly scarce.
In the early stage of process development, microbioreactors considerably reduce the costs involved in optimizing the conditions needed to achieve maximum cell growth and the desired protein attributes. However, this approach not only decreases the volume of materials, but it also increases the number of samples required at the design of experiment (DoE) stage since optimizations are carried out in multiple microbioreactors.
Sample scarcity presents challenges in achieving reliable, sensitive separation of intact proteins and their subunits, and can be an obstacle during process development. Here, we describe studies that demonstrate the use of a new reversed-phase (RP) capillary column format in LC-MS to deliver high-quality data with high throughput, using minimal amounts of material.
Capillary versus standard column performance
Capillary columns for biomolecule analysis deliver increased sensitivity resulting from the concentrating effect of the narrow bore and the higher ionization efficiency ascribed to low flow rate. These benefits enable the acquisition of high-quality MS data using less sample. Various analyses were carried out on different therapeutic antibodies and their subunits to examine the performance of a new reversed-phase capillary column (MAbPac RP capillary, Thermo Scientific) in a low-flow liquid chromatography system (Ultimate™ 3000 RSLCnano, Thermo
Scientific). This performance was compared with that of an equivalent MAbPac RP 2 standard column used in a high-flow ultra-high-performance liquid chromatography (UHPLC) setup (Vanquish Flex UHPLC, Thermo Scientific).
Full experimental details for all the work described are available in Reference 1.
Initial studies were designed to directly compare the performance of the capillary MAbPAC column (150 mm × 0.15 mm, running at 2 μL/min) and a standard MAb-PAC column (50 mm × 3 mm, running at 500 μL/min) for the analysis of rituximab. Tune conditions were optimized to yield the same data quality with respect to glycoform distribution. Experimental results are shown in Figure 1.

Injecting a relatively low amount (15 ng) of the intact mAb on the high-flow column produced a broad peak (Figure 1A). This can be attributed to the dispersion caused by the large internal diameter of the column, which leads to dilution of the analyte and results in reduced quality spectra (Figure 1B) and a poor signal-to-noise ratio. Analysis of the same amount of mAb on the capillary column significantly improved peak shape and reduced noise level, with the production of good quality spectra.
There were also differences in the deconvoluted spectra for the standard (Figure 1C) and capillary columns (Figure 1F) in terms of the number and distribution of glycoforms identified.
This last finding prompted further work to ensure that the glycoform differences observed were not caused by different source conditions in the two experiments. The confirmatory experiment involved running a larger sample (125 ng) of the mAb on the high-flow column (Figure 1G). This produced high-quality spectra, and following deconvolution, the number of glycoforms observed was the same as those seen when running a 15 ng sample on the capillary column and also had a very similar distribution.
It was only at this level of sample injection (125 ng) in the high-flow system that it became possible to see the low-abundance glycoforms that were clearly detected at 15 ng in the capillary system. The total ion chromatograms (TICs) for five other intact mAbs shown in Figure 2 illustrate that the capillary system works just as effectively for other proteins, indicating the global utility of the column.

Thus, the injected 15 ng mAb falls within the loading capacity of the capillary column, and the resulting mass spectrum provides detailed identification of even minor glycoforms. This contrasts with the 3 mm column chromatography where the 15 ng sample proved insufficient to generate spectra of adequate quality at a flow rate of 500 μL/min. When analyzing 15 ng mAb, the peak area of the TIC using capillary flow was 140 times higher than when the sample was analyzed in the high-flow system.
These findings show that using the capillary column during the early stages of process development can overcome the hurdles presented by sample scarcity and ensures that analysis does not become a rate-limiting step.
Separating power for multiple applications
There are advantages in being able to use small sample volumes for LC-MS at many stages throughout therapeutic protein research and development. One example is during lead candidate selection where samples are limited, but intact protein analysis and understanding glycosylation are important in supporting critical decision making. Being able to see even low-abundance glycoforms at this early stage may be vital before risking further expensive development. Working with small sample volumes also minimizes costs, especially when working with expensive enzymes and other high-value reagents. One such high cost enzyme is EndoS, an endoglycosidase that specifically cleaves the b-1,4 linkage between the two GlcNAc units in the core of the glycans on the Fc portions, leaving a GlcNAc unit with or without a-1,6 linked fucose on the protein. Work with EndoS to compare innovator and biosimilar trastuzumab confirms the performance of the capillary system in this application.
Comparison of the deconvoluted spectra from intact analysis of the innovator (Figure 3A) and the biosimilar (Figure 3B) suggests that the innovator shows a higher level of galactosylation than the biosimilar and that it has more afucosylated glycans (which correlate with effector function).

To further verify this statement, the intact innovator and biosimilar mAbs were treated with EndoS. With the glycans clipped, the spectral complexity is simplified, and some minor details, which would otherwise remain undetectable, become traceable. The results shown in Figures 3C and 3D reveal the presence of nonenzymatic glycation in both spectra, at a level that is three times higher in the innovator than in the biosimilar. They also confirm that there are more afucosylated glycans in the Fc domain of the innovator trastuzumab.
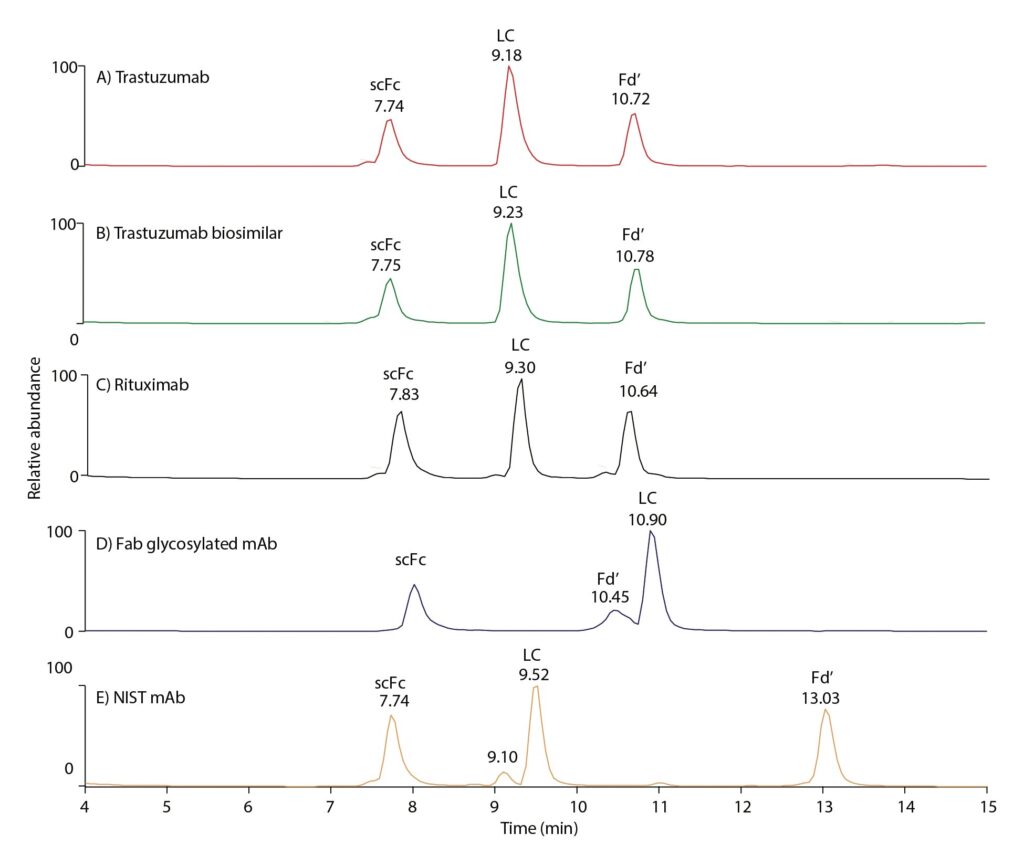
Figure 4 illustrates use of the capillary column in subunit analysis following IdeS digestion. This work was undertaken to investigate the subunit differences responsible for the differences in retention times of the mAbs shown in Figure 2. Resolution and analytical capability were good, further demonstrating the capillary column’s applicability for a range of critical analyses on small samples.
Breaking down the mAbs into subunits such as scFc, LC, and Fd’ with IdeS digestion followed by reduction, helps decipher which of the subunits caused the difference in retention times of the mAbs observed in Figure 2. While retention times are similar between rituximab and trastuzumab subunits (Figure 4), retention time of the Fd’ portion of NIST mAb evidences that the highest retention time (most hydrophobic) of NIST mAb can be attributed to the increased hydrophobicity of the Fd’ subunit. Regarding Fab glycosylated mAb, which was found to be the second most hydrophobic mAb based on Figure 2, the chromatographic behavior of subunits shows that, contrary to the other four examples in Figure 4, the LC elutes far later, indicating this part to be responsible for the increased hydrophobicity of this mAb. The Fd’ portion, bearing an additional glycosylation site, is well resolved from LC and elutes earlier owing to its increased hydrophilic properties.
LC-MS based workflows of intact proteins generally include intact mass and top down approaches, as shown in Figure 5. It is clear that the capillary columns offer the sensitivity and selectivity needed to perform in all these functions with high throughput. This means workflows can be adapted easily to the restrictions imposed when samples are scarce.

The source spectrum generated by averaging over a selected time window of TIC was deconvoluted with Xtract algorithm. (D) Fragment spectrum of thioredoxin acquired by targeted MS2 by 4-plexing. (E) Fragment map shows the assigned fragments to the sequence of thioredoxin with ProSightBP algorithm.
Overcoming obstacles that slow down development
The MAbPAC RP capillary column offers the sensitivity and selectivity needed for successful analysis of intact proteins and mAb subunits. Even though the column chemistry has been miniaturized, this capillary column delivers excellent resolving power, enabling sensitive, high-resolution protein separation at high throughput. It supports all intact protein workflows using only nanogram quantities of sample, allowing the accurate determination of multiple critical attributes with greatly reduced sample volumes.
This advance is expected to alleviate difficulties associated with frequent sampling from low-volume microbioreactors at early stages of process development in biopharmaceuticals, thus overcoming an obstacle that otherwise slows down progress. As demonstrated, it is easily adapted to the whole intact protein workflow, providing an ideal tool for discovery proteomics as well as the early optimization phases of biopharmaceutical development.
Sandra Rontree, PhD, is product marketing manager at Thermo Fisher Scientific.
Reference
1. High sensitivity capillary LC-MS analyses of low amounts of therapeutic antibodies and their subunits. Application Note. Thermo Fisher Scientific. Accessed: March 26, 2021
