June 15, 2017 (Vol. 37, No. 12)
Analyzing Cell Metabolism and Optimizing Culture Media
A survey of scientists developing bioprocesses found efficiency to be the top concern, with pressure growing each year to “produce more, do it more quickly, and do so with fewer resources.”1
Yet, this conflicts with the realities of bioprocess development, which has been inherently slow, empirical, and expensive. In this tutorial, I explain how Phenotype MicroArray™ technology from Biolog can assist bioprocess development scientists by improving efficiency and increasing the chances of reaching an optimal process. These issues are common to bioprocess development with all types of cells, but in this tutorial I will focus on mammalian cells.
Bioprocess Development
Bioprocess development has multiple stages, each with unique challenges. Often, the process development starts with comparison of multiple potential clones, which need to be characterized; tested in small-scale culture with different media or other culture variables; then evaluated for growth, productivity, and consistency. Furthermore, the development process must be kept within a tight project timeline that constrains the ability to examine a comprehensive set of process parameters.
Phenotype MicroArrays provide a solution to the scientist’s need because they enable the testing of hundreds of culture variables at the same time in a single experiment. Additionally, they enable rapid determination of the metabolic properties of cells, which is important in both media design and comparison of clones.
Biolog’s Phenotype MicroArrays consist of different sets of chemicals preloaded and dried into wells of 96-well MicroPlates™. They are essentially 96 tests in a ready-to-use format (see the Phenotype MicroArray setup video at www.biolog.com/video/pmm_assay_protocol.php). A simple yet powerful experiment is to inoculate multiple MicroPlates with cells in a starting culture medium and examine the effect of hundreds of chemicals as potential additives on cell growth and productivity.
For example, the chemicals in the PM-M1 MicroPlate contain 91 different carbon sources that may be useful culture medium additives. This PM-M1 MicroPlate contains a triple repeat of an empty negative control well (A1–A3), a triple repeat of an α-D-glucose-containing positive control well (B4–B6), and single wells of 90 other diverse biochemicals. The 11 different PM-M MicroPlates for mammalian cells currently contain 718 different tests, including 367 carbon and energy sources, 284 nitrogen sources, 22 inorganic ions and metals, and 45 hormones and other metabolic effectors.
Assay Applications
The assays are run by adding 50 µL of a cell suspension to each well and incubating the cells in the presence of the culture variables for an appropriate period of time. To measure cell growth or survival in the well, 10 µL of a Biolog Redox dye mix is added. The rate of purple color formation is proportional to the number of viable cells in the well.2 For cell productivity assays, the wells can be tested for the amount of product produced. For example, if the product is a monoclonal antibody, the levels of the antibody can be measured with a colorimetric ELISA.
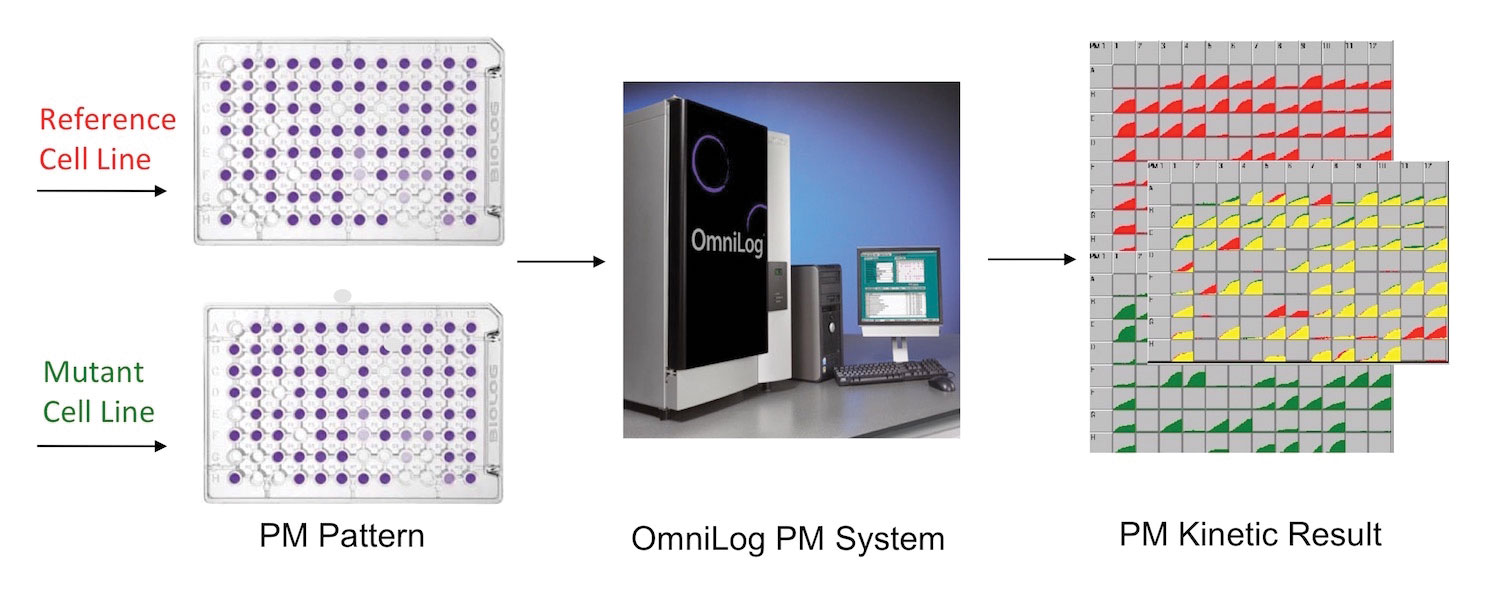
Often, the improvements are small and incremental, so it is crucial to have methodology that can detect, for example, a 10% increase in growth rate. For this level of sensitivity, and also to take full advantage of labor savings and high-throughput screening, Biolog’s OmniLog® instrument (Figure 1) is a combined incubator and reader that accommodates up to 50 plates for a total capacity of nearly 5,000 assays, with settings to read every 5 or 15 minutes.

Figure 1. Example experiment comparing two cell lines
Figure 1 further demonstrates the value of the kinetic data collected automatically by the OmniLog. It shows an example where two cell lines (e.g., a reference cell line and a clonal variant or mutant) are compared. Kinetic data are collected on each MicroPlate, and metabolic rate graphs are generated on each well by the Phenotype MicroArray analysis software. The reference cell is graphed in red and the other cell in green. To generate a direct comparison, the software produces an overlay, and wherever the red and green overlap, the color is changed to yellow. Hence, yellow indicates assays where the cells behave identically, and red or green indicate metabolic differences.
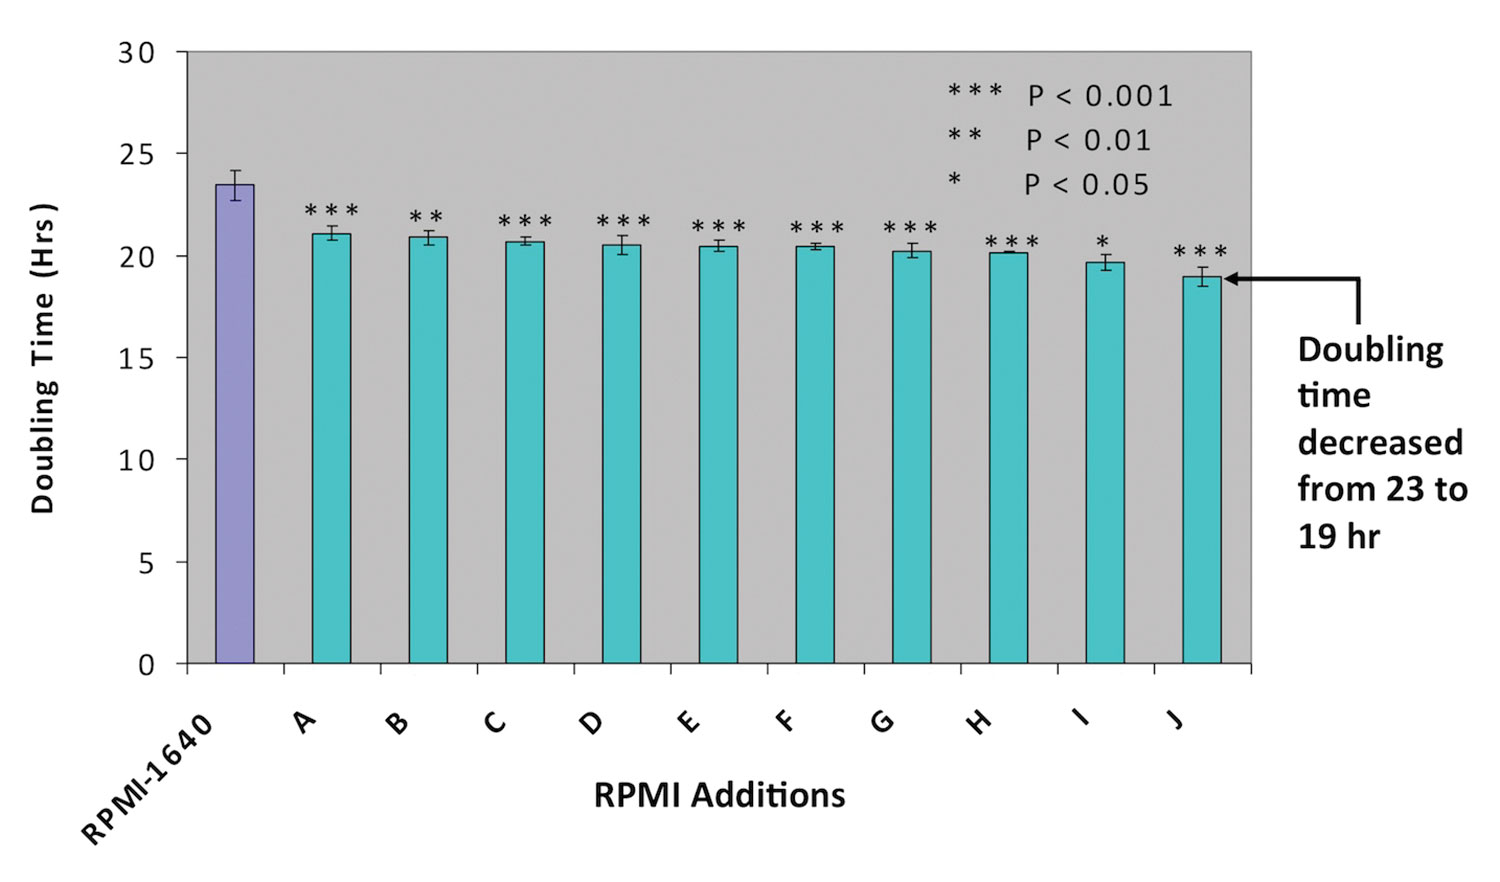
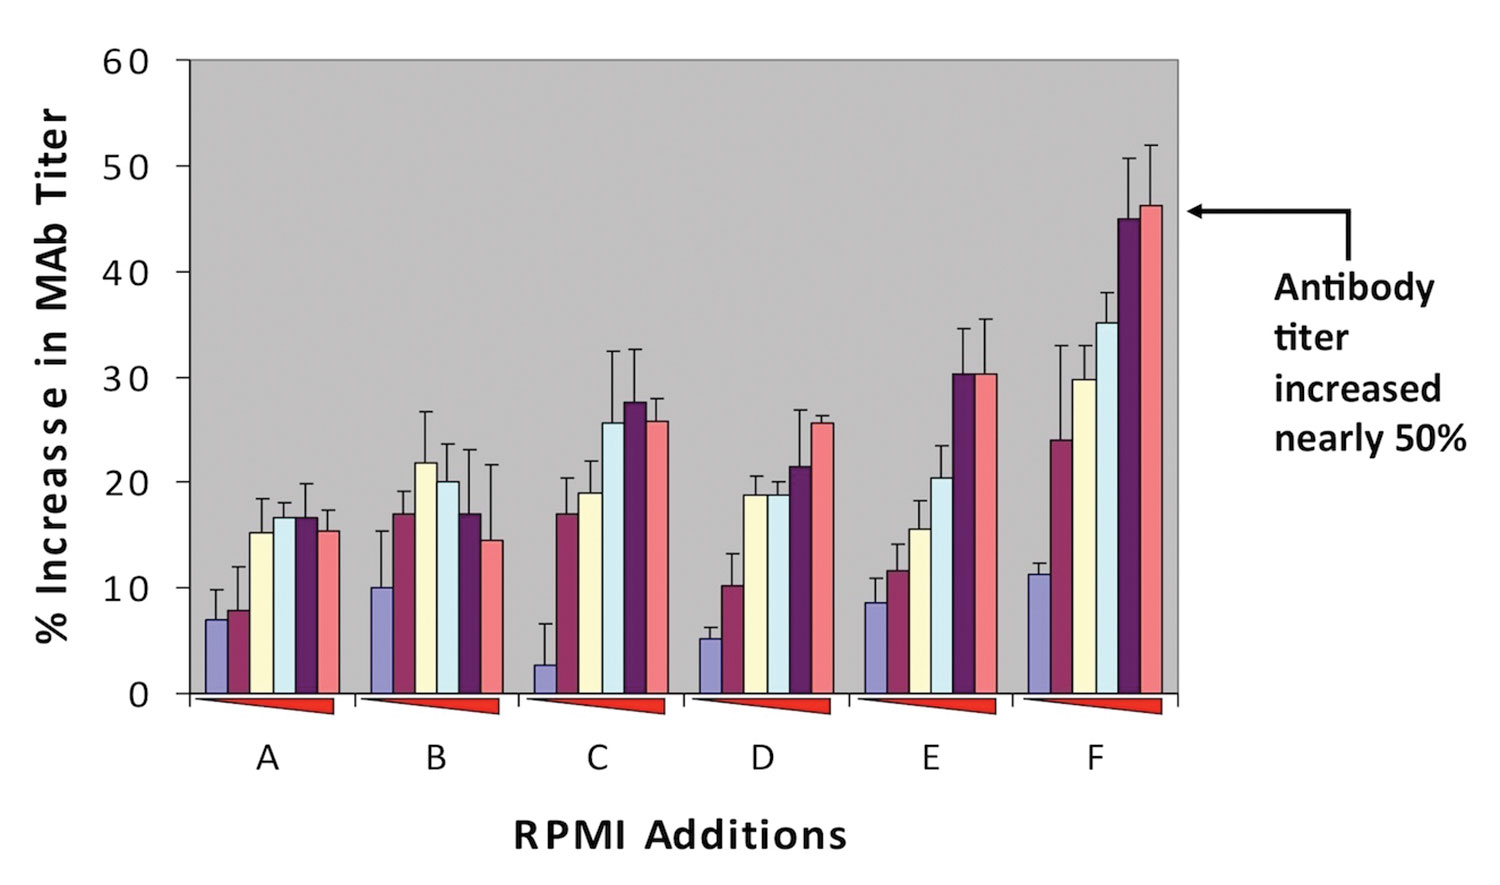
Figure 2 shows use of the technology to improve cell growth. In this example, CHO cells in RPMI 1640 medium were tested with compounds from the Phenotype MicroArray plates identified as enhancing cell growth. Ten compounds were found to stimulate the growth rate, and one that was most effective decreased the doubling time from 23 down to 19 hours. Figure 3 is an example where a mouse cell line producing a monoclonal antibody was tested with compounds identified by Phenotype MicroArrays, and an ELISA assay was used to measure antibody productivity. Six compounds were found to stimulate productivity in a dose-dependent manner, and one that was most effective increased yield by nearly 50%.

Figure 2. Ten substrates augment CHO growth on glucose
CHO cells and preoptimized culture media are most commonly utilized in mammalian-cell bioprocesses. However, in spite of more than 20 years of R&D, surprising discoveries related to culture media are still made. For example, controlling levels of copper in medium has been shown to offer some benefits,3 as has substituting mannose for glucose.4 Mannose and copper are just two of the 718 culture medium variables in the Phenotype MicroArray plates.
Although CHO cell bioprocesses have worked well, CHO cells were chosen primarily for genetic, not metabolic, reasons. As CRISPR technology facilitates genetic improvements to CHO cell lines, this technology can be used to quickly and efficiently examine the metabolism of cell lines. And as scientists use Phenotype MicroArray technology to explore advantages of diverse non-CHO animal cells, it is likely that some may be found to offer growth, productivity, or glycosylation advantages over CHO cells.

Figure 3. Six substrates increase monoclonal antibody titer
Conclusions
In this tutorial, we have focused on the advantages offered by Phenotype MicroArray technology in analyzing the metabolism of cells and optimizing their growth and productivity. However, this technology offers additional benefits to bioprocess-based manufacturing groups, such as in verifying the metabolic characteristics of banked cells and monitoring and identifying microbial contaminants.
References
1. Langer E. 2014, GEN, Online Exclusive, June 12, 2014, Bioprocessing trends to expect in 2014.
2. Bochner BR, Siri M, Huang RH, Noble S, Lei X-H, et al. 2011. Assay of the multiple energy-producing pathways of mammalian cells. PLoS ONE 6(3): e18147.
3. Luo J. Vijayasankaran N, Autsen J. Santuray R, Hudson T, Amanullah A, and Li F. 2012. Comparative metabolite analysis to understand lactate metabolism shift in Chinese hamster ovary cell culture process. Biotechnol. Bioeng. 109: 146–156.
4. Berrios J, Altamirano C, Osses N, and Gonzalez R. 2011. Continuous CHO cell cultures with improved recombinant protein productivity by using mannose as carbon source: Metabolic analysis and scale-up simulation. Chem. Eng. Sci. 66:(11): 2431–2439
Serena Chan, Ph.D. ([email protected]), is a field application scientist at Biolog.
Contact Biolog at [email protected] for more information.


