April 1, 2015 (Vol. 35, No. 7)
New Confocal Imaging Instruments Allow Screening in Complex Human Liver Microtissues
A functional impairment of hepatobiliary transporters such as bile salt export pump (BSEP) and multidrug resistance-associated protein 2 (MRP2) are strongly associated with an increased risk of liver injury. In recent years it became clear that in vivo animal rodent models are unreliable for prediction of hepatotoxicity due to inhibition of BSEP function. Several cases were reported in which these models did not correctly predict the onset of liver injury, which only became evident in clinical trials.
For example, Amgen’s compound AMG 009 showed no evidence of liver injury in rats, mice, hamster, rabbits or nonhuman primates. However, five out of eight healthy volunteers showed significant elevations in transaminases, indicating onset of liver injury (Morgan et al., 2013. Tox Sci). Currently, screening for BSEP inhibition is mostly performed with artificial in vitro models, such as BSEP-expressing membrane vesicles. These vesicles proved to be a useful tool for screening and showed a good concordance of BSEP inhibition observed at low concentrations and liver injury in humans. However, some compounds identified as BSEP inhibitors showed no evidence of liver injury in vivo.
It is therefore hypothesized that knowledge of a compound’s effect on the other major bile acid efflux transporters (e.g., MRP2), may help to further discriminate compounds and limit false positives. In addition, since these transporters require ATP as energy to translocate substances across the cell membrane, the metabolic integration in a hepatocyte environment may play a crucial role for the activity of these transporters.
In conventional 2D hepatocyte cultures, for example, the establishment of bile canaliculi is limited since the cellular contact between hepatocytes are often missing. In contrast, hepatocytes in 3D spheroid cultures were shown to build extensive bile canaliculi network throughout the microtissue, as exemplified by InSphero’s 3D InSight™ Human Liver Microtissues.
The presence of BSEP and MRP2 on the apical membrane toward the bile canaliculi indicates that this model system might be a useful tool to study the effects of efflux-inhibiting compounds in a complex 3D environment. Since the 3D liver microtissues are viable and functional over several weeks, long-term studies of efflux transporters are now possible.
The complex 3D structure of the spheroids poses challenges for cellular high-content analysis (HCA). For example, cell visualization in 3D models is impaired because light scattering and absorption prevent imaging of regions deeper in the tissue.
High-Content Screening
With the newly designed Opera Phenix™ High Content Screening System from PerkinElmer it is now easier to study complex cellular models such as 3D microtissues. Its Synchrony Optics™ can provide excellent confocality and enable simultaneous acquisition of up to four channels with minimal crosstalk. The confocal microscope spinning disk has a special design with an increased pinhole-to-pinhole distance for reduced spatial crosstalk from out-of-focus planes, which results in clearer images of 3D microtissues.
A test setup was developed that allows the quantification of BSEP or MRP2 mediated efflux of fluorescent probes. First, the 3D liver microtissues were incubated for 24 hours with the compounds Sitaxsentan (BSEP-inhibitor), Cytochalasin (F-actin inhibitor), or FCCP (mitochondrial toxicant). After compound treatment, the probe substrates were added. These dyes were used: Hoechst to visualize nuclei; TMRM to visualize mitochondrial membrane potential; CMFDA (5-chloromethylfluorescein diacetate) to test for MRP2 activity; and CLF (cholyl-lysyl-fluorescein) to test for BSEP activity.
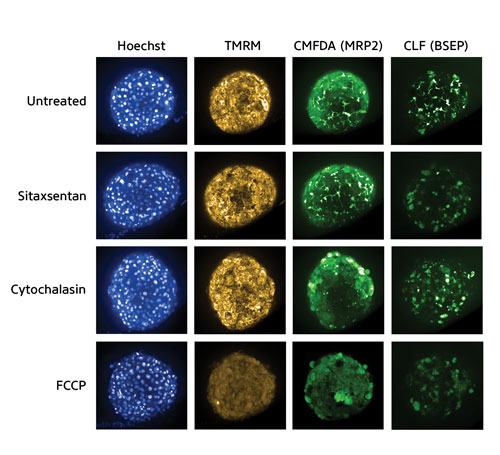
The dyes were added for 45 minutes to the untreated and the pretreated 3D liver microtissues, no washing steps were performed. Z-stacks of 0–60 µm in 5 µm intervals were imaged using a 20xW objective on the Opera Phenix High Content Screening System. Representative images are shown in Figure 1.
As expected, accumulation of fluorescent probes in bile canaliculi were seen in untreated tissues. In contrast, pretreatment with the BSEP inhibitor Sitaxsentan resulted in a loss of CLF accumulation in bile canaliculi, whereas MRP2 mediated transport of CMFDA was not inhibited by Sitaxsentan.
Cytochalasin abrogated the diffusion of the CMFDA and CLF within the bile canaliculi, which is facilitated by F-actin mediated bile canaliculi contractions. Therefore, only spots of accumulated CMFDA and CLF in bile canaliculi were observed. The overall mitochondrial membrane potential was not affected by Sitaxsentan or Cytochalasin, but by FCCP—as expected.

Figure 1. Maximum intensity projection sample images of 3D InSight™ Human Liver Microtissues stained with Hoechst, TMRM, and either CMFDA or CLF. The microtissues were pretreated for 24 hours with either Sitaxsentan, Cytochalasin, or FCCP (each 100 µM).
Automated analysis of bile canaliculi area was achieved by analysis of maximum intensity projection images of the 60 µm stacks. In the CMFDA or CLF channel, cells filled with the dye were excluded, and a Gauss-filtered image was merged with the original image to calculate an image with enhanced contrast and normalized intensity. Finally, the bile canaliculi area and the overall TMRM intensity were calculated.
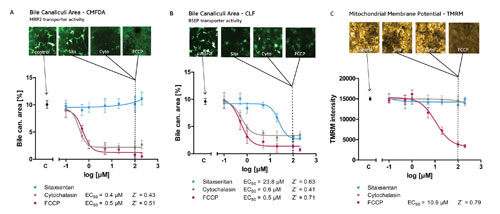
The results of this analysis are shown in Figure 2A–C. Plotting the bile canaliculi area versus the compound concentration allowed the calculation of a dose-response curve. A clear dose-response relationship was observed for Cytochalasin and FCCP on CMFDA and CLF export, whereas Sitaxsentan was specifically inhibiting only BSEP-mediated CLF accumulation. The mitochondrial membrane potential was only affected by FCCP treatment, but not by the other tested compounds.
To find a good compromise between acquisition time, data volume, and data quality, the minimal stack sampling rate needed for measurement and image analysis was tested during assay development.

Figure 2. Analysis of bile canaliculi area after compound treatments. (A) MRP2 transporter activity and inhibition assessed by CMFDA. (B) BSEP transporter activity and inhibition assessed by CLF. (C) Mitochondrial membrane potential assessed by TMRM.
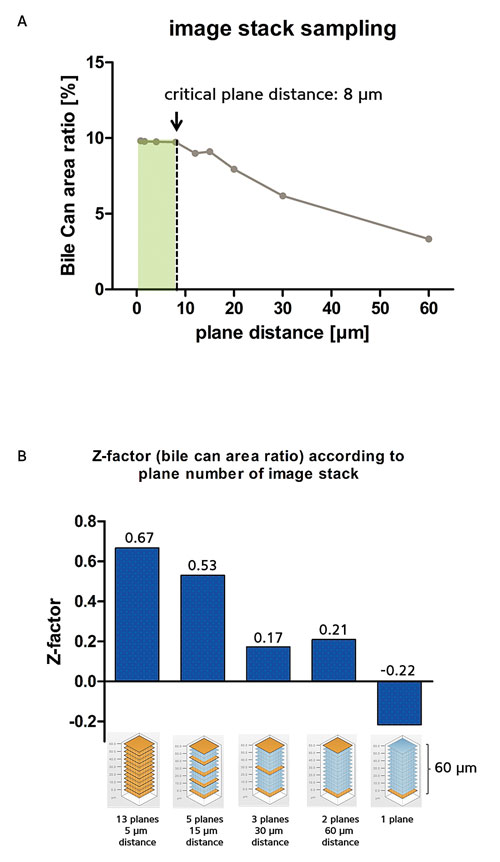
Figure 3A shows that the bile canaliculi area ratio remained similar, if an inter-plane distance of up to 8 µm is used. Increasing the distance beyond 8 µm led to a loss of detected canaliculi. Based on the sampling results, a plane distance of 5 µm was used in the assay. The Z-factor (Z’) was calculated for different plane distances as shown in Figure 3B.
Z´ is a commonly used measure of the statistical quality of a high-throughput assay. Assays with a Z´ between 0.5–1.0 are regarded as ideal, whereas Z´ below 0.5 should be avoided. With the current assay setup (5 µm plane distance) a Z´ of 0.67 was reached. Using 15 µm distance resulted in a Z´ of 0.53, 30 µm distance dropped the Z´ to 0.17.
Therefore, a plane distance between 5–8 µm can be recommended for this 3D assay, as this keeps acquisition times and data volume acceptable and allows for good image resolution along the z-axis and excellent Z´ values. These results also show that the computationally efficient analysis of maximum intensity projections can provide excellent results, and the computationally more expensive volumetric analysis of 3D is not always required.

Figure 3. Image stack sampling and Z-factor calculation according to plane distances and numbers. (A) Bile canaliculi area ratio calculations based on plane distances. (B) Z-factor calculation based on number of planes and plane distances used.
Conclusion
Merging powerful confocal imaging techniques with novel organotypic 3D liver models harbors the potential to transform screening for efflux transporter inhibition. The technique presented herein utilizes a 384-well plate, containing a single microtissue per well. This allows automated measurement and image processing in a high-throughput setting. Importantly, the higher biological relevance of the liver model in comparison to the currently used BSEP expressing membrane ves icles should allow a better prediction of the negative effects of efflux-transporter inhibiting drugs in pre-clinical research.


