March 1, 2011 (Vol. 31, No. 5)
Methodology for Carrying Out an Analytical Study and Detergent Selection
Membrane proteins are key components of living cells. They constitute one-third of the ORFs of virtually all genomes, perform crucial roles, and are targeted by a huge number of drugs.
When present in their native environment, transmembrane proteins are inserted via hydrophobic segments in a lipidic bilayer. Their in vitro characterization requires the extraction of proteins from the membrane and the maintenance of them in a soluble and native state. This is generally achieved using amphiphilic compounds, termed detergents, yielding so-called protein-detergent complexes (pdc). Several membrane proteins are naturally found as oligomers, and maintaining this precise assembly is a crucial issue for further studies.
In this article, we describe a method to determine the quaternary structure of membrane proteins and to follow its retention during protein handling. It is well known that classical size-exclusion chromatography (SEC) using column calibration does not apply in the case of pdc, whose volume and shape also depend on the detergent fraction. Light scattering coupled to chromatography is a promising technique, it does not suffer from the usual bias affecting batch measurements, and it allows the evaluation of sample homogeneity, oligomerization state, protein-protein interaction, and complex formation with other chemical species.
An illustration of this method is provided by the quaternary structure study of the Methanosarcina mazei CorA transporter in two detergents. Crystallographic studies of a homologous CorA revealed that the protein works as a pentamer to conduct ions across the membrane and constitutes a suitable system to characterize the effect of detergents on its oligomeric state.

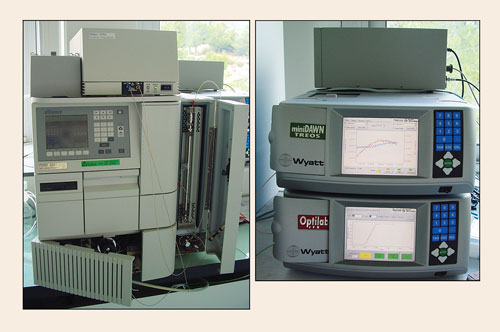
Figure 1. Instrumental setup: Left: Protein samples are separated using an analytical SEC column run on an Alliance HPLC 2695 system before entering the Photo Diode Array 2996 where optical density measurements are achieved. Right: After exiting the Photo Diode Array, the sample is further analyzed with a three-angle static light scattering MiniDAWN TREOS detector (middle) and an Optilab rEX refractometer (bottom). A dynamic light scattering apparatus may be added for on-line hydrodynamic radius determination with a DynaPro DLS instrument (top).
Methodology
We used a combination of UV spectrophotometry (UV), multi-angle light scattering (MALS), and refractometry, coupled on-line with an analytical SEC column to analyze both integrity and quaternary structure of purified CorA in two different detergents (Figure 1).
UV, MALS, and refractometry measurements were achieved with a Photo Diode Array 2996 (Waters), a MiniDAWN TREOS (Wyatt Technology) and an Optilab rEX (Wyatt), respectively. We used a 15 mL KW-804 column (Shodex) run at 0.5 mL/min-1 on an Alliance HPLC 2695 system (Waters). The buffer used was 10 mM Tris (pH 8.0), 300 mM NaCl, 5% (v/v) glycerol and 0.05% n-dodecyl-b-D-maltopyranoside (DDM) or 0.1% lauryl-dimethyl-N-amine-oxide (LDAO).

Figure 1. Instrumental setup
The Zimm’s formalism for the static light-scattering eqation gives:
where R(Θ,c) is the excess Rayleigh ratio of the solution as a function of scattering angle Θ and the solute weight concentration c. It is directly proportional to the intensity of the scattered light in excess of the light scattered by the pure solvent.

Equation 1
Mw is the weight-averaged solute molar mass. A2 is the second virial coefficient in the virial expansion of the osmotic pressure. P(Θ) describes the angular dependence of the scattered light and can be related to the radius of gyration. K* is the constant 4π2(dn/dc)2n02/Naλ04. Na is Avogadro’s number; dn/dc is the refractive index increment with molecular concentration; n0 is the solvent refractive index and l0 is the wavelength of the incident light.
P(Θ) approximately equals 1 in the case of biopolymers. The weight concentration c of the solute, for soluble nonconjugated proteins, can be measured on-line either with optical density at 280 nm or with refractometry. At the low concentrations usually encountered in SEC, the virial coefficient term is negligible. For protein alone, dn/dc is constant and is comprised of between 0.18 and 0.185 mL/g-1.
In the case of membrane proteins, a two-component analysis can be carried out to quantify the proportions of protein and detergent. We achieved this analysis using ASTRA software (Wyatt).
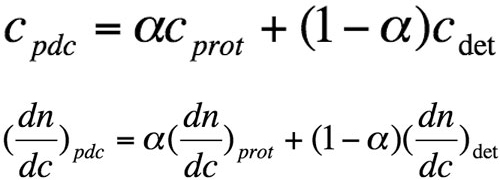
For a pdc, one cannot directly measure the concentration (cpdc) of the eluted species, and the refractive index increment with molecular concentration (dn/dcpdc) is not known a priori. The two terms correspond to the weighted sum of protein and detergent contributions:

Equation 2
where α is the weight proportion of the protein in the pdc, cprot, and cdet are the respective weight concentrations of protein and detergent, and (dn/dc)prot and (dn/dc)det are refractive index increments with molecular concentration, respectively. We used values of 0.133 and 0.148 mL/g-1 for (dn/dc)det of DDM and LDAO, respectively.
Using equation 2, the concentration of the pdc can be expressed as follows:
where n is the measured refractive index difference between pdc solution and solvent.

Equation 3
Similarly, the Beer-Lambert equation can be developed as the sum of contributions from both protein and detergent in the pdc:
where OD280 is the optical density at 280 nm; εpdc, εprot, and εdet are the extinction coefficients at 280 nm, expressed in g/L-1, for the pdc, the protein alone and the detergent, respectively. εprot was theoretically calculated from the protein sequence and εdet is assumed to be 0.003 (Anatrace data sheet).
cpdc and α are unknown in this “two equations with two unknown parameters” system formed by equations 4 and 5. The combined use of UV and refractometry allows one to solve this system and to get values for cpdc and α for each point of the chromatogram. cpdc is then used in equation 1 and the Mw is thus calculated for each point of the chromatogram thanks to the MALS. Mw values for both protein and detergent fractions are finally deduced using the value of α.

Equation 4
Results
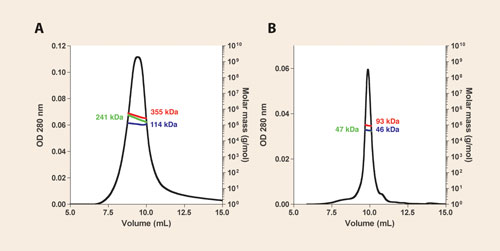
Superposition of the gel-filtration chromatogram (OD280 trace only) of purified CorA revealed that CorADDM eluted slightly earlier than CorALDAO and that the elution profile of the latter was sharper and more symmetrical. However, SEC/MALS/refractometry/UV allowed us to measure the masses of the whole pdc in DDM (355 kDa) as well as the respective masses of the protein fraction (241 kDa) and the detergent belt (114 kDa), as illustrated in Figure 2A.
The mass of the protein fraction nicely fits with the theoretical mass of the CorA pentamer (5 x 46.9 kDa = 234.5 kDa vs 241 kDa), i.e., the physiological quaternary structure. With LDAO, in contrast, we found a total pdc mass of 93 kDa, corresponding to the sum of 47 kDa of protein and 46 kDa of detergent.
Thus, LDAO led to complete dissociation of CorA into monomer-containing-micelles, a non-native state of this protein (Figure 2B). These results helped us distinguish which detergents are suitable for purifying this archeal CorA using ~100 μg of protein for each injection.

Figure 2. SEC/MALS/UV/refractometry characterization of M. mazei CorA purified in DDM (A) and LDAO (B) using a 15 mL Shodex KW-804 column. The left y axis represents the OD280 while the right y axis is the molecular weight. Colored traces show measured molecular weights along the chromatographic peak. The whole pdc mass (red trace) is composed of the sum of the protein mass (green trace) and the associated detergent (blue trace). Values of the measured masses at the volume corresponding to the top of each peak are reported according to the same color scheme.
Conclusions
This case study illustrates the impact of this method as a powerful tool to study membrane proteins and their detergent belt by allowing accurate mass measurements without column calibration. Generally, classic calibration based on soluble proteins does not apply in the case of pdc, whose volume and shape also depend on the detergent fraction.
The method described in this article serves to identify the quaternary structure of membrane proteins and to follow the presence of the correct folding of oligomeric proteins throughout purification. When the expected quaternary structure is known, this elegant approach provides clues about the retention of the native and thus active protein structure without performing laborious activity tests. This biophysical characterization technique improves thus dramatically the probability of success when carrying out crystallization or other biochemical studies requiring active and homogeneous protein samples.
David Veesler ([email protected]), Stéphanie Blangy, Giuliano Sciara, and Christian Cambillau are scientists at the Architecture et Fonction des Macromolécules Biologiques, CNRS & Universités d’Aix-Marseille I & II, in Marseille, France. For more information on Wyatt Technology’s MiniDAWN and Optilab rEX, please visit www.wyatt.com.


