
July 1, 2006 (Vol. 26, No. 13)
Data Pipelining Software Provides Fast & Easy Customized Analyses of Biological Data
The scientific method is an iterative process of making observations, creating hypotheses, making predictions, and then testing these predictions to further validate or disprove the hypothesis. However, to simplify today’s complicated bioinformatics environment of various biological data formats and algorithms, a set of static tools or processing pipelines often gets created.
Scientists are then faced with the difficulties of a one-size-fits-all data-processing paradigm that does not meet their needs. Static data-processing pipelines hinder the iterative scientific method by making it difficult or expensive to change pipelines for ad hoc analyses or prototype processing improvements. Conversely, rather than create processing pipelines, the scientist may spend a large amount of time moving information in and out of in-house and Internet tools and algorithms and summarizing the results in spreadsheets on desktop computers.
Although flexible, this manual integration of data and algorithms is also difficult and expensive because significant time is spent by the scientist manipulating data or results. Both paradigms lack efficiency and act as blocks to the scientific method, delaying scientific discovery and development.
SciTegic’s (www.scitegic.com) Pipeline Pilot software creates an environment where algorithms and data types are easily integrated into a single data-pipelining paradigm that allows quick and customizable data analyses and report building. The user interface is simple to use, giving the everyday scientist the ability to build customized data-processing workflows by mixing and matching algorithms and parameters. Both the internal and external data and algorithms can be integrated into Pipeline Pilot. This processing environment supports the scientific method by providing flexible and quick manipulation of data-processing pipelines for iterative experimentation and result gathering.
Prototyping and Experimentation
Data-pipeline building and manipulation is uncomplicated with an intuitive, visual user interface. Data-processing components are shown as block-like icons connected with pipes that indicate the data flow. Users drag data-processing components from an Explorer pane (tool pane) to the Pipeline pane, where components are connected to other components.
Simple data-processing pipelines can be represented as a single-line pipeline (Figure 1). More complicated pipelines can be created having one or more branch points (Figure 2). In addition, multiple pipelines can be created for the purpose of processing all the data in one pipeline prior to passing it on to the next.
Data can flow from one or more sources to one or more destinations. For example, Figure 1 shows sequence data being read from a file of SwissProt entries, a FASTA file, and a database. In this example, each sequence data record is read in turn by a sequence reader component, flows through the pipe, and enters the next component, where the data record is typically modified in some way and then passed along to the next component.
Filter components can be added to partition data based on some defined criteria. It is often useful to connect additional components to both exit ports of a filter to create a branching pipeline. Data pipelines often end in a viewer, report generator, or a file writer. File-writer components are available for a variety of file formats or for writing to a database.
Integration of data and data-processing components is achieved within Pipeline Pilot by converting all input data into a single, hierarchical data model. By converting different data formats to a consistent data object, the data object becomes the currency that is shared among the various algorithms and utilities that are integrated.
Every Pipeline Pilot component converts inputs and outputs to and from this data-object currency as needed. The use of this data currency means that the scientist need not be concerned with data formats and algorithm-specific inputs and outputs, making data pipelines easy to manipulate. Each component is interoperable and can be added or removed with a click of a mouse, or customized with a small amount of typing. Being able to create and modify data-processing pipelines in this manner simplifies the process of prototyping new algorithm combinations, and supports the iterative scientific process.
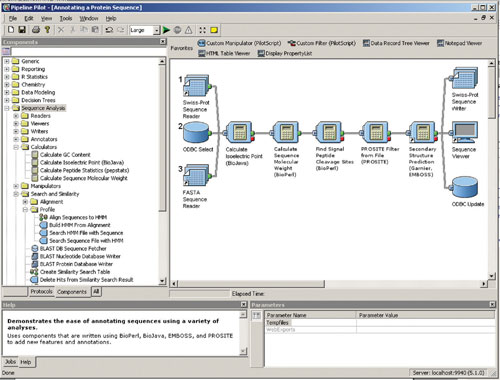
Fig. 1: The Pipeline Pilot user interface and the building of a data-processing pipeline. The Explorer pane shows the sequence analysis components on the left with the Data-pipeline building pane on the right.
Algorithm Integration
The Sequence Analysis Component Collection contains over 70 bioinformatics algorithms and utilities available for drag-and-drop data-pipeline creation. The example in Figure 1 illustrates some simple components of the Sequence Analysis Component Collection and the versatility of using algorithms of different sources and codes bases.
This component collection is not intended to be an all-encompassing set of bioinformatics components, but a fundamental set of tools for sequence data analysis. To add in-house or third-party algorithms as components, integration tools are available that make wrapping algorithms a straight-forward process, typically by using Perl/BioPerl, Java/BioJava, and Python adaptors. Additionally, remote execution of algorithms on different severs can be achieved using SOAP and Run Program components via FTP, TELNET, SSH, or SCP.
The end result is a large collection of algorithms from diverse sources, represented as interoperable components. This algorithm integration provides the bench scientist with a consistent and flexible environment to create, test, and modify data-processing pipelines.
Data integration continually poses a problem in biology. In spite of efforts to create data standards, effective data-processing pipelines must have the ability to read a variety of data formats. Pipeline Pilot achieves data integration with the adaptation of existing algorithms and code to work with the Pipeline Pilot data-object model. With this unification, it becomes possible to integrate different types of data within a single data object. Data integration occurs when reading in different data of different formats and also occurs as inputs and outputs are converted to and from other software code objects within components, for example converting BioPerl or BioJava objects dynamically to and from the Pipeline Pilot object.
Figure 1 shows not only the integration of file formats, but as each data record is passed from component to component, the data object integrates the results of each component as it progresses.
Data integration can also occur at a higher level of organization. Components of the Reporting Collection in Pipeline Pilot are used to create reports that contain text, charts, and graphs and are typically used to condense and summarize information about a dataset that has passed through the data-processing pipeline (Figure 2 and 3). These reports are also easily customizable, and the content can be updated in real-time. Because they are easily manipulated, the use of the reporting collection can negate the need for ad-hoc spreadsheets, alleviating the scientist of significant data manipulation.
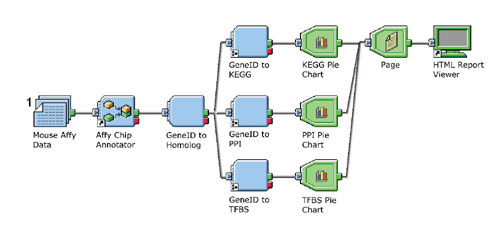
Fig. 2: Branched Pipeline Pilot data-processing pipeline annotating mouse Affymetrix IDs. Report building components are shown in gree and summarize all of the data records that flow through the pipeline and present the results in an HTML Web page.
Deployment
The sharing of useful pipelines with other scientists is critical to scientific validation and collaboration. A key benefit of Pipeline Pilot is the ability to greatly simplify processing pipelines and share these pipelines with others. Done through a web page, command-line or hyperlink, once a pipeline is created, it can be deployed to a large number of users and tested by others.
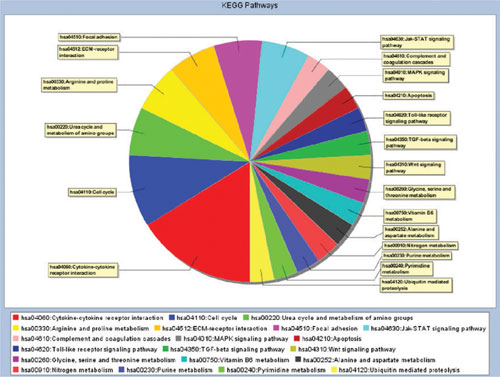
Fig. 3: Pie chart showing the distribution of gene IDs in pathways defined by KEGG.
Summary
Bioinformatics is just one scientific area that greatly benefits from a Pipeline Pilot solution. With genomes being sequenced at a record rate, an explosion of microarray expression, SNP, and heterozygosity data, and increasing pathway information, there is abundant data to be integrated and analyzed. Pipeline Pilot gives bioinformaticians and scientists the speed and flexibility to efficiently follow the scientific method by quickly and easily creating data-processing pipelines and summary reports.


