
May 15, 2006 (Vol. 26, No. 10)
Measuring Enzyme Kinetic Parameters with the ITC Universal Enzyme Assay Method
Enzymes are important in drug discovery and development since they constitute approximately one-half of all known drug targets. Researchers need to understand how enzymes work with natural substrates before they can develop new therapeutic agents. Traditional assays use spectrophotometric or chemical detection methods. However, there are many enzymes that currently use a complex assay or have no functional assay at all. This tutorial describes the use of Isothermal Titration Calorimetry (ITC) as a universal enzyme assay method.
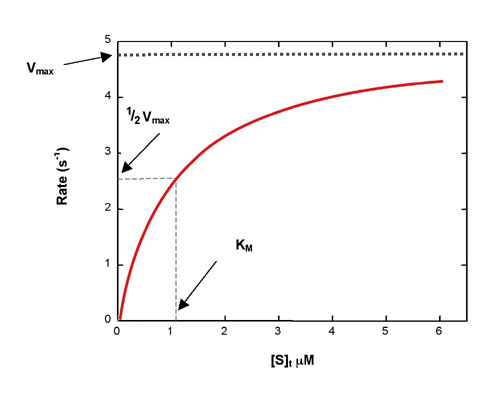
Figure 1: Simulated Michaelis-Menten curve generated with equation 2
Overview of Enzyme Kinetics
When an enzyme (E) interacts with its substrate (S), an enzyme-substrate complex (ES) is formed. This complex is converted to its transition state (ES*), then enzyme-product complex (EP). Finally, the enzyme-product complex dissociates to give free enzyme and product. In biological systems, where the substrate concentration is much higher than enzyme concentration, the reaction is simplified to: [see equation 1 on left]where k1 is the rate constant for formation of ES and k-1 is the rate constant for dissociation of ES. [E] is the total enzyme concentration in the reaction.
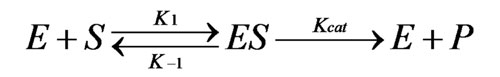
Equation 1
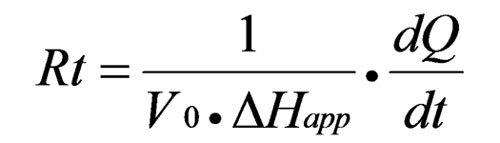
The catalytic rate constant is kcat. Reaction rate, Rt, is determined by the Michaelis-Menten equation:[see equation 2 on left]where [E] is enzyme concentration, [S]t is instantaneous substrate concentration, and KM is the Michaelis constant. A hyperbolic rate plot is generated in a graph of Rt vs. [S]t (Figure 1). Vmax is the rate when the curve plateaus, and KM is equal to [S]t at 1/2 Vmax, where half of the enzyme molecules are in ES form.
Traditional methods to determine enzyme kinetics are: continuous assays, where the rate is determined by spectroscopic measurement of product generation (or substrate depletion), discontinuous assays, where the reaction is stopped at fixed time point(s) and the amount of product is measured, and coupled assays, where the product of enzymatic catalysis is the substrate for a second reaction, which can be monitored by continuous or discontinuous assay.
It is not always possible or straightforward to measure changes in substrate or product concentration, due to interference of spectrophotometric detection, or because the substrate (or product) does not have a chromophore or fluorophore, or there is no known assay.
What is needed is a universal enzyme assay that is rapid, precise, can be used for activity screening and is directly applicable to any enzyme-substrate system without the need for chemical tagging.
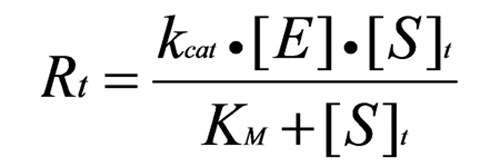
Equation 2
ITC and Enzyme Kinetics
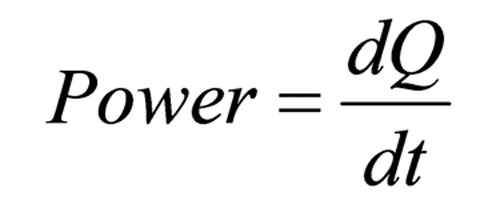
ITC is a universal detector of heat changes associated with chemical reactions. It measures the thermal power generated by the enzymatic conversion of substrate to product, which is represented by:[see equation 3 on left]where Q is heat, and t is time. This thermal power change is detectable and measurable, and the VP-ITC (MicroCal; www.microcalorimetry.com) is sensitive enough that enzyme requirements are similar to those of spectrophotometric assays.
Equation 3
Researchers have demonstrated that the rate of product formation (or rate of reaction) can be determined from thermal power using the equation:[see equation 4 on left]
Where V0 is the volume of the ITC cell and ΔHapp is the total molar enthalpy of the reaction. A complete Michaelis-Menten curve is generated from one set of ITC titrations. [S]t and [E] are calculated after each ITC injection, using initial substrate and enzyme concentrations and ITC injection volumes. dQ/dt for each [S]t are determined as described below. Rt (from equation 4), [S]t and [E] are fit to Equation 2 to solve for KM and kcat. Origin 7.0 software for ITC performs data analysis of enzyme-substrate ITC experiments, and calculates KM and kcat using non-linear least-squares regression analysis.
Equation 4
Experimental Design for Enzyme Kinetics Analysis with ITC
Enzyme and substrate are prepared in identical buffer solutions, and if any cofactors are required, this is also included in both solutions. The experimental temperature is between 20󈞑 C. Total enzyme concentration in the ITC cell should be much less than total substrate concentration in the syringe, and initial substrate concentration greater than KM.
There are two methods that can be used to measure enzyme kinetic parameters with ITC: pseudo-first-order conditions and continuous assay conditions.
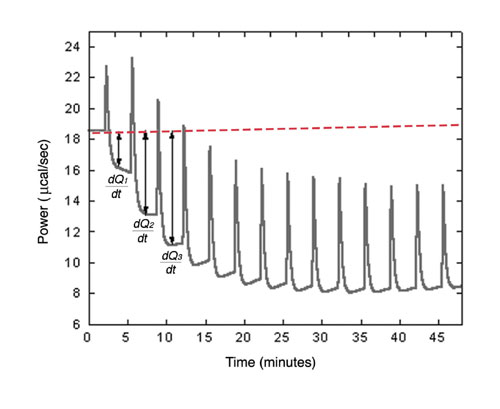
Figure 2a: Raw ITC data for measurement of reaction rate for hydrolysis of PNPP by PP1-y phosphatase.
Calorimetric Measurement of Pseudo-First-Order Enzyme Kinetics
An ITC experiment is performed to measure dQ/dt after each substrate addition, using conditions to maintain steady state. For this method, it is recommended that KM be greater than 10 µM. If KM if lower than 10 µM, the continuous assay is suggested.
The recommended enzyme concentration range in the ITC cell is 25 pM to 1 mM. In general, the higher the enzyme-substrate affinity, the lower the enzyme concentration. The recommended substrate concentration range in the ITC syringe is 10 µM to 100 mM, it needs to be above KM and in excess of enzyme concentration in cell. Suggested injection parameters are 2󈞀 µL per injection and 15󈞊 injections.
The suggested interval between injections is three minutes to establish a new thermal power baseline before the next injection. This change in thermal power baseline is due to heat produced (or absorbed) from the enzymatic reaction; the ITC cell requires different power levels to maintain thermal equilibrium. As a general guideline, no more than 5% of the substrate should be converted before the next injection.
After completion of the experiment, Origin 7.0 software for ITC automatically performs data analysis. dQ/dt is determined by measuring the difference between original baseline and new baseline after each injection (Figure 2a). [S]t and [E] are also calculated after each injection. DHapp is determined in a separate ITC experiment. Using Equation 4, Rt is determined for each [S]t and data fit to Equation 2 to solve for kcat and KM.
Figure 2a shows ITC data for the titration of PP1-g phosphatase with PNPP. The power generated (dQ/dt) at each substrate concentration is proportional to the rate of reaction. Data from Figure 2a are used to determine the reaction rate at different substrate concentrations, and these are plotted in Figure 2b. As a comparison, data generated from spectrophotometric assays are also shown. Kinetic parameters obtained by the two assay methods are in excellent agreement. Since many substrates of protein phosphatases cannot be monitored with a spectrophotometer, ITC can be useful to study enzyme kinetics and mechanisms as well as in the design of therapeutic agents.
The steady-state ITC method has been used to determine the enzyme kinetics parameters of several enzymes, including H. pylori urease, E. coli GroEL chaperonin, heparinase I, yeast hexokinase, HIV protease, pyruvate carboxylase, and dinucleoside polyphosphate hydrolase. Values determined by ITC agree with enzyme parameters determined by other methods.
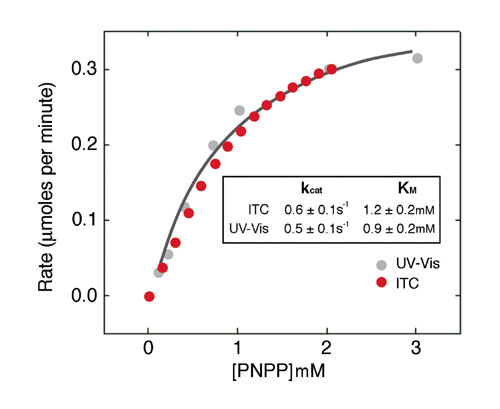
Figure 2b: Michaelis-Menten curve for hydrolysis of PNPP by PP1-y hydrolase.
Calorimetric Measurement for Continuous Assay Enzyme Kinetics
An alternative strategy for obtaining enzyme kinetics parameters involves continuous rate measurements after a single injection of substrate. When substrate is completely depleted, thermal power returns to pre-injection baseline (Figure 3). DHapp is determined by integration of the area under peak. At any given time the concentration of substrate is calculated and rate vs. substrate concentration is plotted to give a continuous kinetic curve.
For the continuous method, the recommended enzyme concentration in ITC cell is 1󈞅 nM, and the recommended substrate concentration in ITC syringe is 10 µM to 100 mM, above KM and in excess of enzyme. The ligand is added in a single injection of 25 µL, followed by data collection for 1,200𔃀,000 seconds (Figure 3).
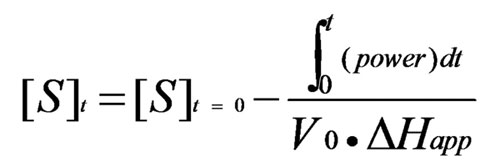
After completion of the experiment, Origin 7.0 for ITC automatically performs data analysis, including integration under peak to determine DHapp. Enzyme rate at time t is calculated from Equation 4, and instantaneous substrate concentrations are determined by: [see equation 5 on left]Data are fit using Equation 3 to calculate kcat and KM.
The continuous enzyme assay method was used to calculate kinetic parameters for yeast cytochrome-c oxidase, chitinase, bovine dihydrofolate reductase, and trypsin. ITC results agreed with data from other assays.
Equation 5
Competitive Inhibitors
Enzyme kinetics experiments can be performed in the presence of a competitive inhibitor in the ITC cell, using the multiple injection or continuous method. Preliminary experiments in the absence of inhibitor are required, and DHapp and kcat do not change in the presence of a competitive inhibitor. Figure 3 shows continuous assays in presence and absence of inhibitor. Origin 7.0 software for ITC calculates KI and KM. The ITC method has been used to look at 2-mercaptoethanol inhibition of H. pylori urease (KI of 4.1 mM), and benzamidine inhibition of trypsin (KI of 16 µM).
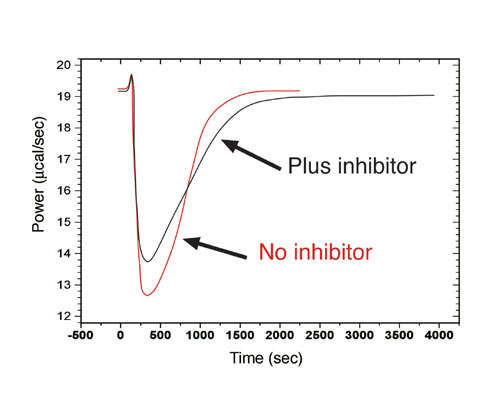
Figure 3: Raw ITC data for continuous assay. Red: absence of inhibitor; black: presence of inhibitor. The area under each curve was identical.
Summary
ITC is a practical tool in enzyme assay development. Many enzymes have no assay, or complex assays, and ITC is a universal assay. ITC involves minimal method development, is universal for any enzymatic reaction where there is a heat change, and is a sensitive technique with modern ITC instruments. ITC is a label-free technique and does not require chromogenic or fluorogenic substrates. ITC can generate enzyme kinetics parameters from a single experiment and it is appropriate for enzymes from every EC classification. ITC data are comparable to other enzyme assay methods and generate thermodynamic information along with kinetics parameters.


